
Slow Calls
Slow tool calls are the most common source of poor user experience in MCP servers. A tool that takes 2 seconds instead of 50ms makes the AI client feel unresponsive — and the user has no visibility into why.
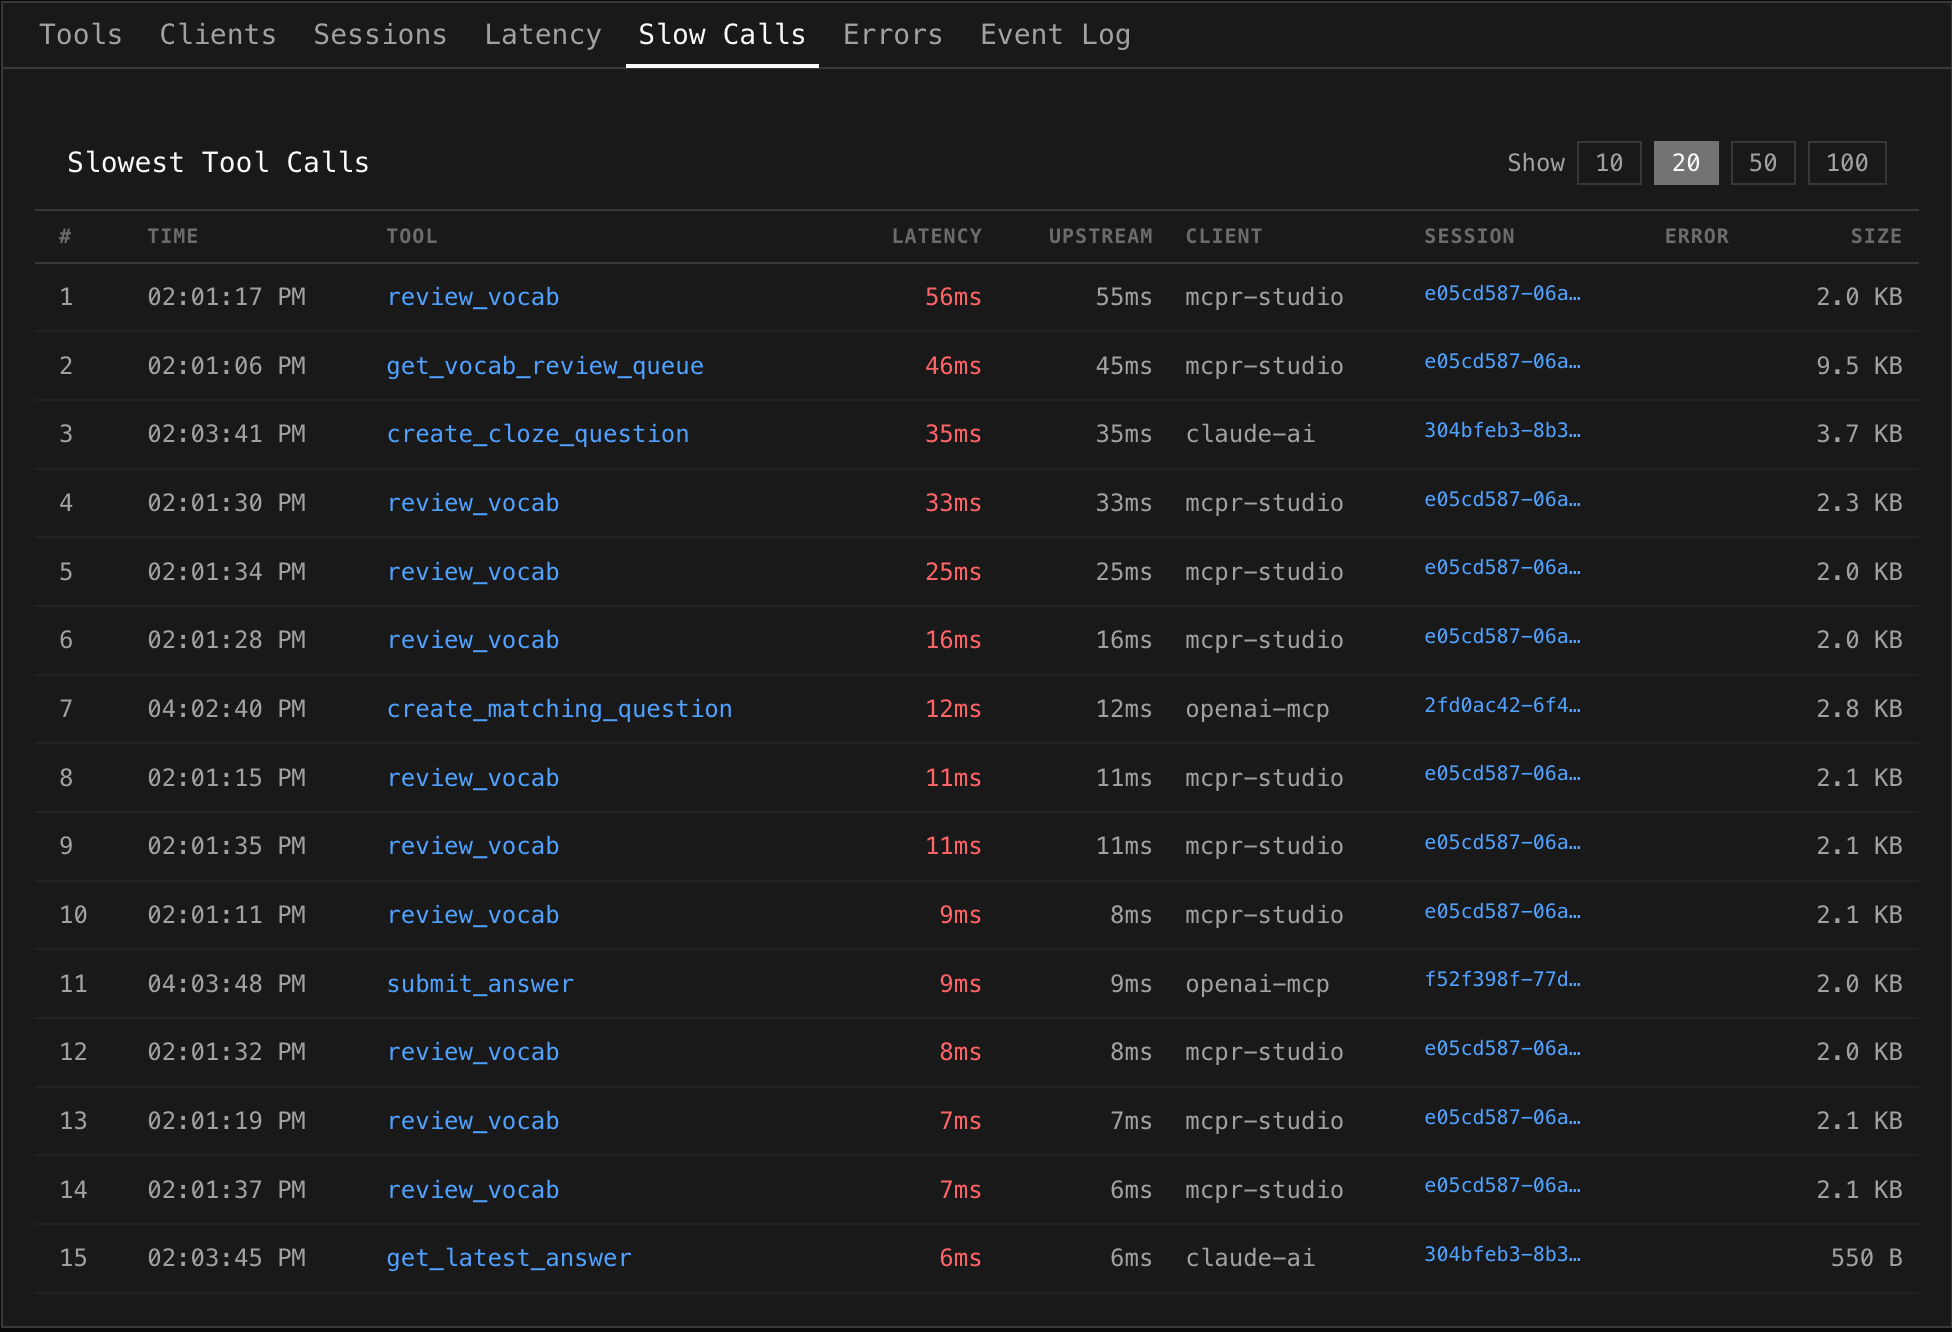
The Slow Calls tab on the server dashboard surfaces exactly which calls were slow, how slow they were, and gives you the data to figure out why.
Reading the table
Section titled “Reading the table”Each row is a single MCP tool call, ranked by total latency (slowest first):
| Column | What it shows |
|---|---|
| # | Rank by latency |
| Time | When the call happened |
| Tool | Which tool was called (clickable — jumps to Event Log filtered to that tool) |
| Latency | Total end-to-end time (proxy receive → response sent). Red when notably slow |
| Upstream | Time your MCP server spent processing. Compare with Latency to see proxy overhead |
| Client | Which AI client made the call (e.g. mcpr-studio, claude-ai, openai-mcp) |
| Session | Session ID (clickable — jumps to Sessions tab to see the full conversation) |
| Error | Error message, if the call also failed |
| Size | Response body size — large payloads can indicate the cause |
What to look for
Section titled “What to look for”Upstream vs Latency gap
Section titled “Upstream vs Latency gap”If Upstream is close to Latency, your MCP server is the bottleneck — the proxy added negligible overhead. If there’s a gap, the proxy or network added time (rare, but check for large response bodies).
Large response sizes
Section titled “Large response sizes”A call returning 9.5 KB is doing more work than one returning 550 B. If a slow call has a large size, the tool may be fetching too much data or returning verbose responses. Consider pagination or trimming the response.
Errors on slow calls
Section titled “Errors on slow calls”A slow call that also has an error often points to a timeout. Your MCP server spent time working, then failed. Check if the upstream service has its own timeout that’s shorter than expected.
Repeated tools
Section titled “Repeated tools”If the same tool appears multiple times in the slow calls list (like review_vocab in the screenshot), it may have inconsistent performance — sometimes fast, sometimes slow. This often indicates:
- Cache misses — fast when cached, slow when not
- Variable query complexity — depends on input parameters
- External dependency jitter — database or API response time varies
Client patterns
Section titled “Client patterns”Different clients may trigger different performance characteristics. If openai-mcp calls are consistently slower than mcpr-studio calls for the same tool, investigate whether the client sends different parameters or triggers different code paths.
Page size
Section titled “Page size”Use the Show toggle (10 / 20 / 50 / 100) in the top right to control how many slow calls are displayed. Start with 20 to get the big picture, then increase to 100 when investigating a specific tool.
Debugging workflow
Section titled “Debugging workflow”- Open Slow Calls — identify which tools are slow and how slow
- Check Upstream vs Latency — is it your server or the proxy?
- Check Size — is the response unusually large?
- Click the Session ID — see what happened before and after. Was the client retrying? Were other tools also slow in the same session?
- Click the Tool name — jump to Event Log filtered to that tool. See if the slowness is consistent or an outlier
- Cross-reference with Latency tab — check if the tool’s p95 is high in general, or if this was a one-off spike
Relation to other tabs
Section titled “Relation to other tabs”| Tab | How it complements Slow Calls |
|---|---|
| Latency | Shows percentile trends over time — “is this getting worse?” |
| Tool Health | Shows per-tool p50/p95/p99 — “what’s normal for this tool?” |
| Event Log | Full request details — “what exactly was sent and returned?” |
| Sessions | Conversation context — “what happened around this slow call?” |
| Errors | Correlate — “are slow calls also failing?” |