
Sessions & Event Log
Sessions
Section titled “Sessions”A session represents one MCP connection — from initialize through tool calls to disconnect. Each AI client conversation creates one session.
The Sessions sub-tab shows every session in the selected time range:
| Column | What it shows |
|---|---|
| Session | Session ID (clickable — expands to show all events) |
| Client | AI client name + version (from MCP initialize handshake) |
| Started | Timestamp of the initialize message |
| Duration | Time from first to last event |
| Calls | Total MCP requests in this session |
| Errors | Error count (red if > 0) |
| Status | Active (green, events in last 5 min) or Ended (gray) |
| Tools | List of unique tool names called |
Filter by active/ended sessions using the dropdown.
Expanded session view
Section titled “Expanded session view”Click any session row to expand it inline, showing every event in chronological order:
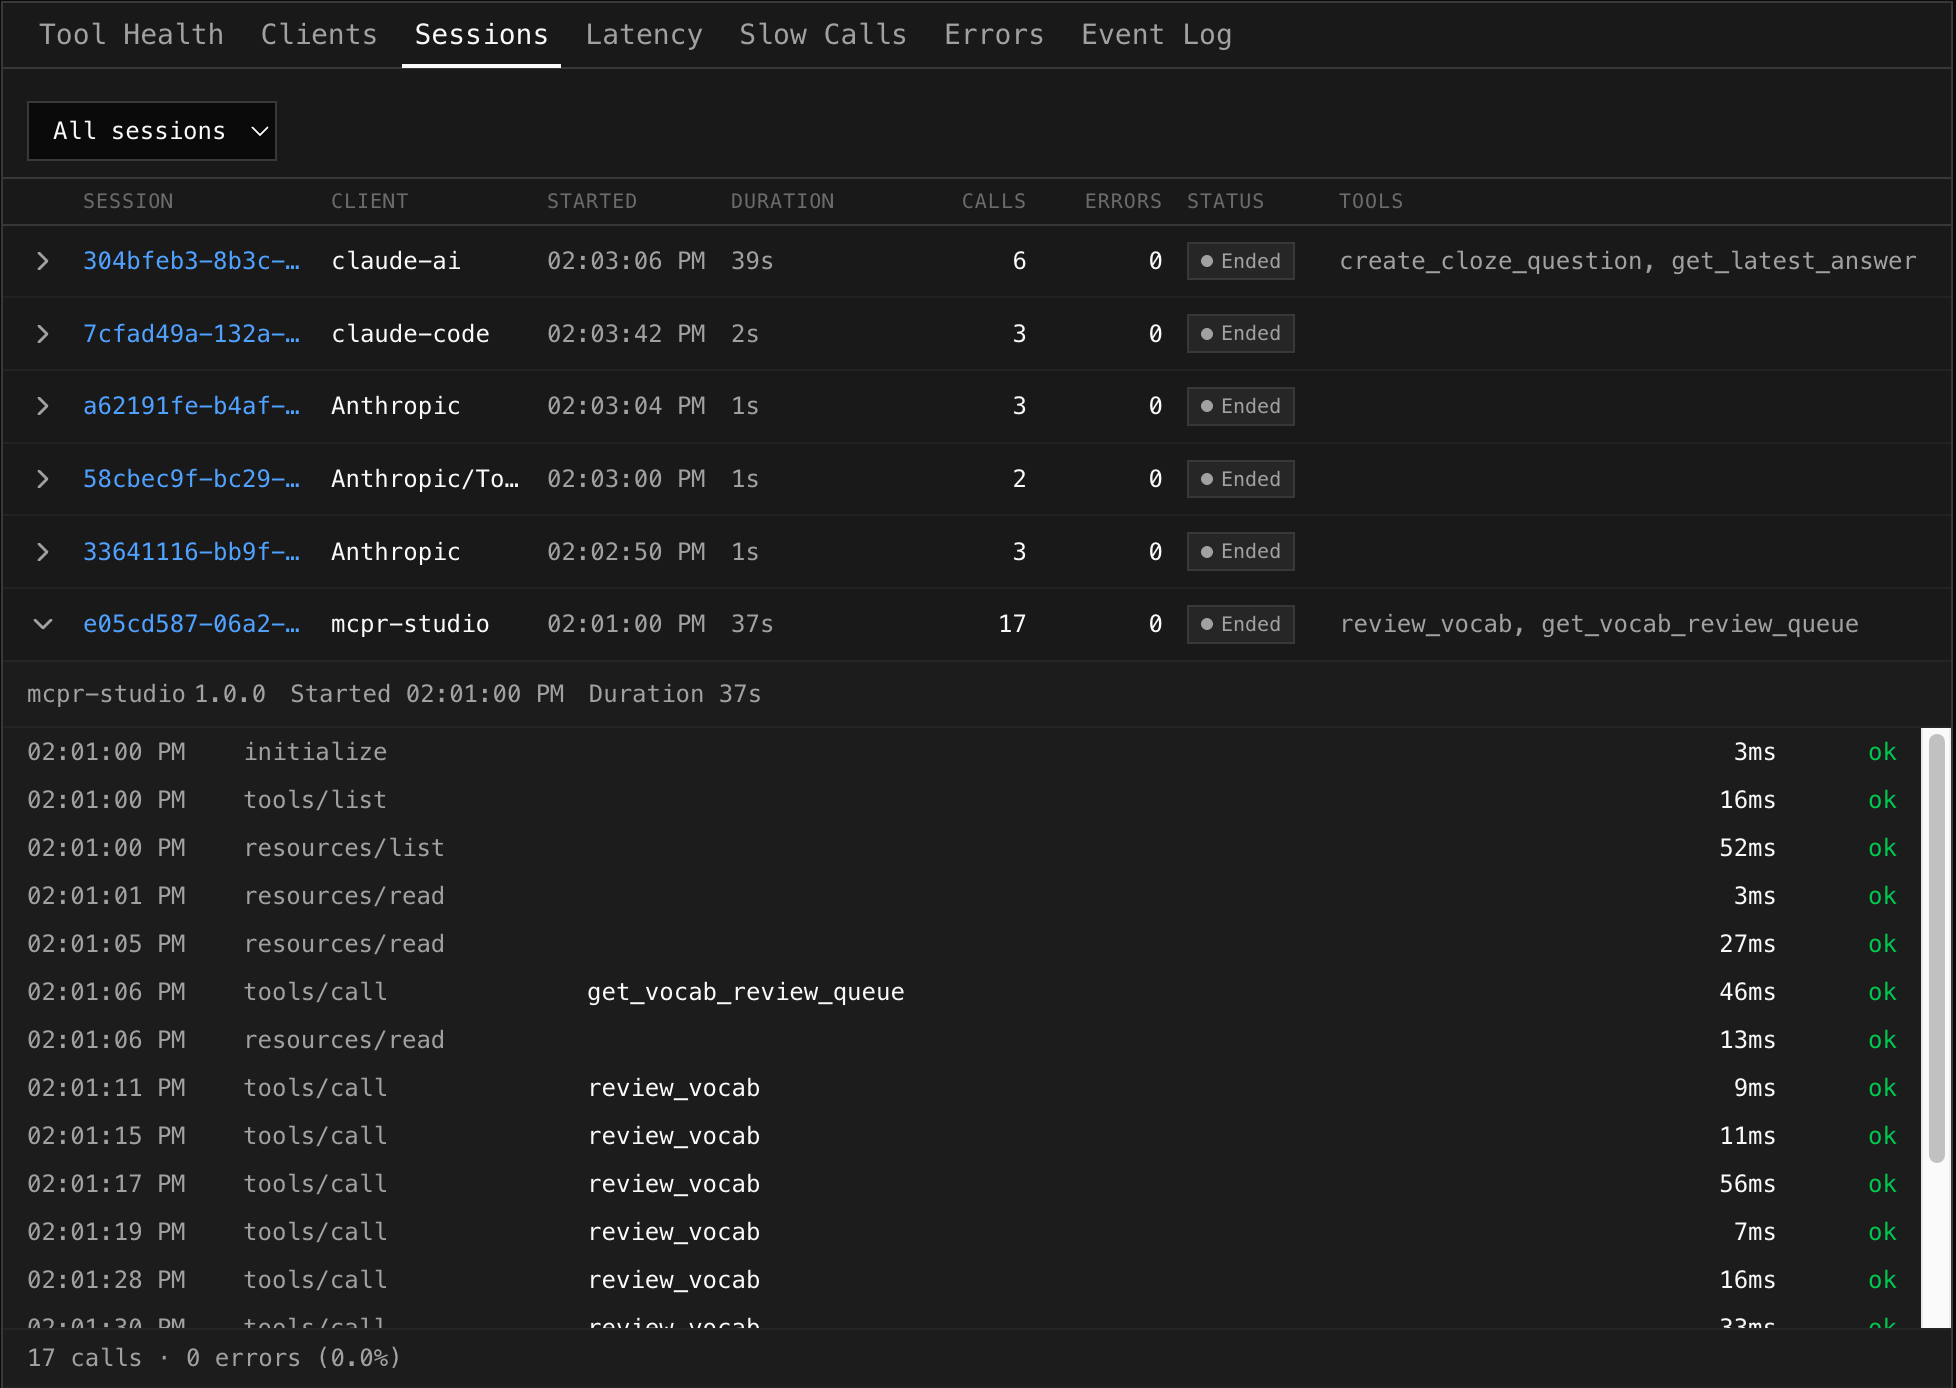
The expanded view shows the full conversation flow:
10:08:45.001 initialize 3ms ok10:08:45.220 tools/list 2ms ok10:08:46.100 tools/call search_products 42ms ok10:08:48.300 tools/call create_payment 2340ms error upstream timeout10:08:52.100 tools/call create_payment 890ms error rate limited10:09:01.200 tools/call create_payment 340ms ok ← retry succeededThis lets you:
- Debug a specific conversation — see exactly what happened, in order
- Spot retry patterns — “create_payment failed twice, succeeded on third try”
- Correlate errors — “this session has 21.7% error rate, all from create_payment”
Session summary
Section titled “Session summary”At the bottom of each expanded session, a summary shows total calls, errors, and error rate for that session.
Event Log
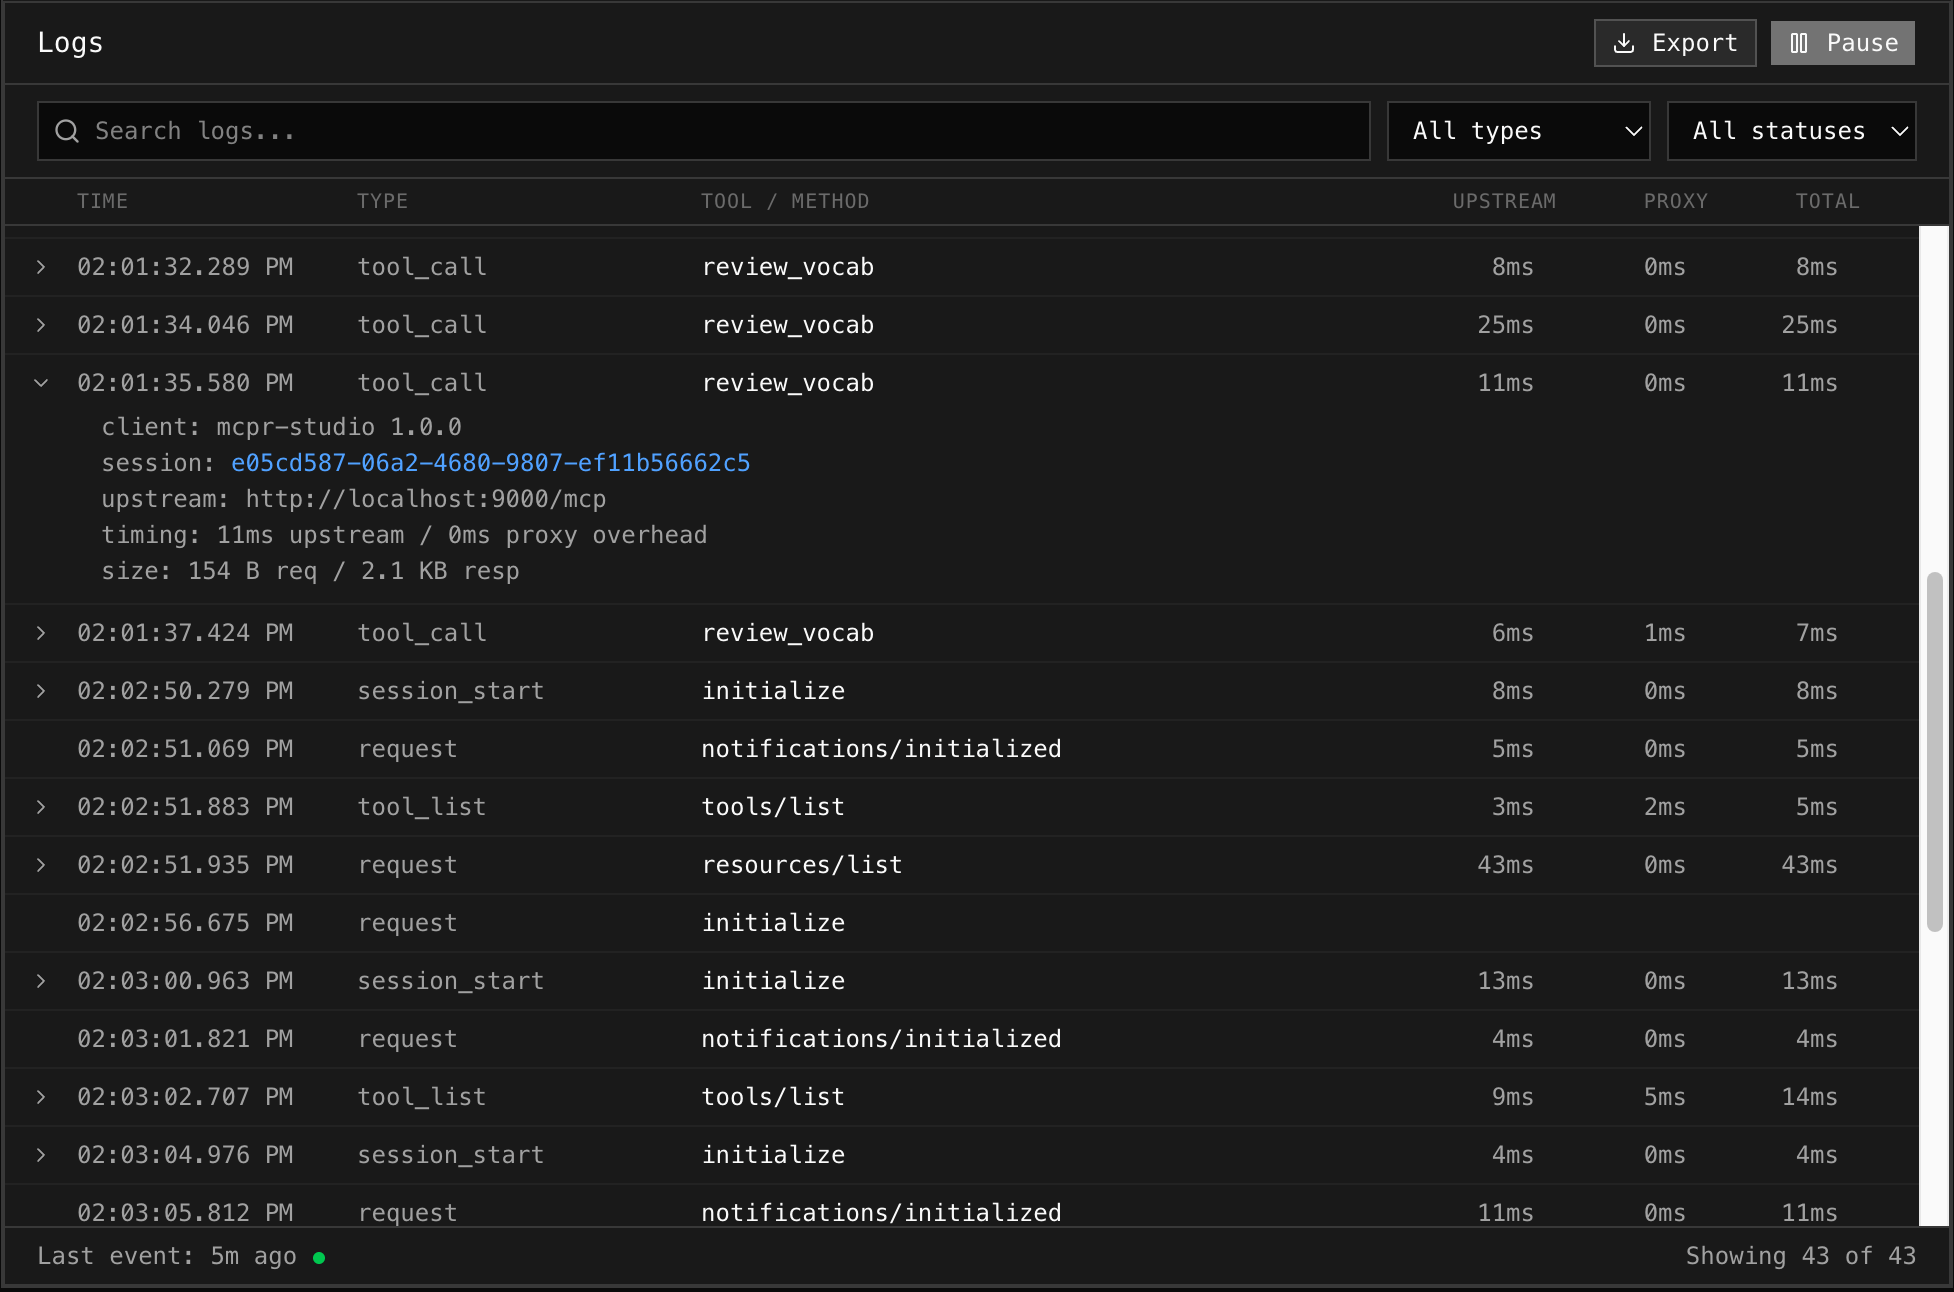
Section titled “Event Log”The raw event stream — every MCP request, every detail.
Columns
Section titled “Columns”| Column | What it shows |
|---|---|
| Time | Timestamp with millisecond precision |
| Type | MCP method — initialize, tools/call, tools/list, resources/read, etc. |
| Tool / Method | Tool name for tool calls, method for other request types |
| Upstream | Time waiting for your MCP server to respond |
| Proxy | mcpr proxy overhead (total - upstream) |
| Total | End-to-end latency |
| Status | ok (green) or error (red) |
Error rows get a subtle red background tint so they stand out when scrolling.
Expanded details
Section titled “Expanded details”Click any log row to expand it and see:
- Error detail — the actual error message from your MCP server
- Client — which AI client sent the request (name + version)
- Session — session ID (clickable — jumps to Sessions tab with that session expanded)
- Upstream — which upstream server handled the request
- Timing breakdown — upstream latency vs proxy overhead
- Size — request and response body sizes
- Metadata — any additional metadata from the event
Live mode
Section titled “Live mode”Toggle the Live / Pause button:
- Live — polls every 2 seconds, auto-scrolls to show new events
- Pause — freezes the view for investigation
In live mode, a green pulsing dot shows in the footer. New events appear at the bottom.
Clickable session IDs
Section titled “Clickable session IDs”Session IDs in the expanded detail are blue clickable links. Clicking one:
- Switches to the Sessions tab
- Auto-expands that session row
- Shows the full conversation timeline
This lets you go from “this request failed” to “what else happened in this conversation?” in one click.
Search & Filters
Section titled “Search & Filters”The Event Log respects the global filter bar at the top:
- Search — matches against tool name, method, session ID, error detail, upstream, client name
- Tools multi-select — selected tools are passed as the search query
- Client filter — appended to the search
- Status filter — filters to OK, Error, or Denied events
- Event type — local filter for specific MCP methods (tool calls, session events, etc.)
Export
Section titled “Export”Click Export to download the current filtered log view as a JSON file. Useful for:
- Sharing with teammates
- Offline analysis
- Attaching to bug reports