
mcpr Cloud
mcpr Cloud turns your MCP proxy into a fully observable production system. It ingests structured events from mcpr and gives you the tools to understand, debug, and optimize your MCP server — before your users report a problem.
Sign up at cloud.mcpr.app.
The problem
Section titled “The problem”You’ve built an MCP server. AI clients are calling your tools. But you can’t answer basic questions:
- “Is my server healthy right now?” — You have no dashboard, no error rate, no latency percentiles. You find out something’s broken when a user complains.
- “Which tool is slow?” — Your server has 10 tools. One of them occasionally takes 5 seconds. You don’t know which one, or why.
- “Is this a server problem or a client problem?” — ChatGPT shows 0.9% errors but VS Code shows 4.8%. Is that your server, the client, or the network?
- “What happened in this user’s session?” — A user reports “the tool didn’t work.” You have no way to trace their specific conversation.
- “When did the errors start?” — Your payment tool started failing. Was it 10 minutes ago? 3 hours ago? Did anything else break at the same time?
mcpr Cloud answers all of these.
What you get
Section titled “What you get”Tool Health — “Is anything broken?”
Section titled “Tool Health — “Is anything broken?””Screenshot placeholder: Tool Health tab — multiple tools with healthy/degraded/inactive status, latency bars, error rates
Every tool your MCP server exposes gets its own health row: status, call count, error rate, p50/p95/p99 latency, and when it was last called. Sorted by p95 — the slowest tools float to the top.
Status isn’t just threshold math. mcpr detects actual failures — connection refused, DNS timeout, upstream unreachable — and only marks a tool as “Down” when there’s real evidence. An idle tool is “Inactive” (gray), not “Down” (red).
Client Breakdown — “Who’s using my server?”
Section titled “Client Breakdown — “Who’s using my server?””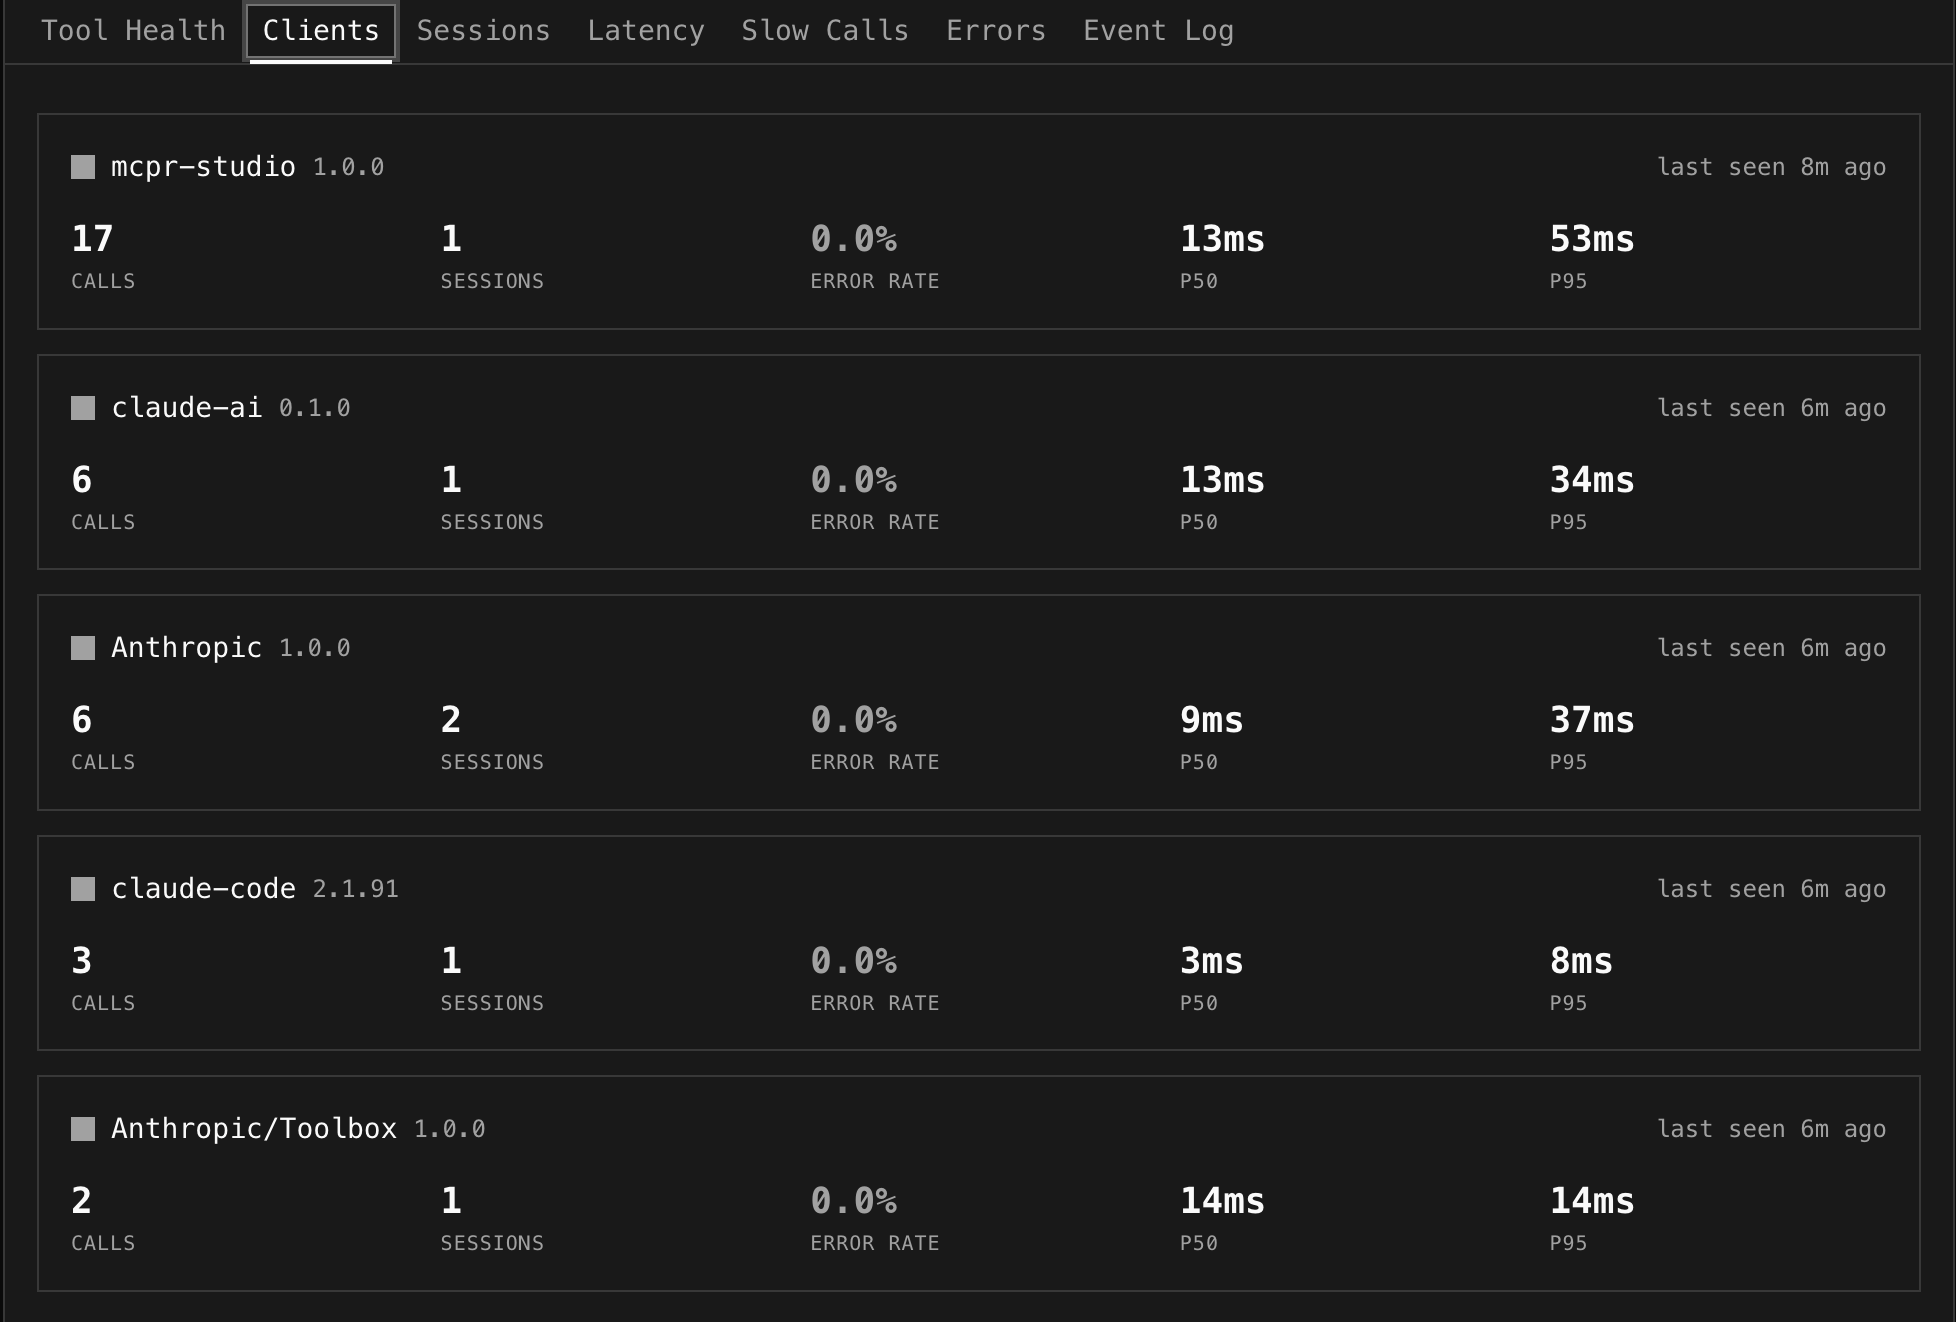
mcpr reads the clientInfo from the MCP initialize handshake and breaks down traffic by client. You see how many calls, sessions, and errors each AI client generates.
Click a client to filter the entire dashboard to that client’s traffic. “VS Code has 4.8% errors but ChatGPT only 0.9%” — now you know where to look.
Sessions — “What happened in this conversation?”
Section titled “Sessions — “What happened in this conversation?””Screenshot placeholder: Session expanded inline showing initialize → tools/list → tool calls with timing
A session is one MCP connection — from initialize through tool calls to disconnect. Click any session to expand it inline and see every event in chronological order.
Debug retry patterns (“create_payment failed twice, succeeded on third try”), trace errors back to their conversation context, and see exactly what the AI client did.
Latency — “Is my server getting slower?”
Section titled “Latency — “Is my server getting slower?””Screenshot placeholder: Overall latency area chart (p50/p95/p99) + per-tool line chart
Two views: an overall area chart showing p50/p95/p99 over time (spot the regression — “p95 jumped at 14:00”), and a per-tool line chart where each tool gets its own line. Toggle between p50, p95, p99. Click tools in the legend to show/hide.
Slow Calls — “Why was this specific request slow?”
Section titled “Slow Calls — “Why was this specific request slow?””Screenshot placeholder: Individual slow calls with vs p50 badges (3.2x yellow, 10.6x red)
The slow tools overview ranks tools by p95 — “which tools should I optimize?” The individual slow calls table shows specific outliers with a vs p50 multiplier: “this call took 10.6x the normal time.”
Each call shows upstream latency vs proxy overhead, request/response sizes, and error details. A 2-second call with a 4MB response is a different problem than a 2-second call that timed out.
Errors — “What’s breaking and when did it start?”
Section titled “Errors — “What’s breaking and when did it start?””Screenshot placeholder: Error rate timeline (per-tool lines) + grouped errors table
Errors are grouped by tool + message — one row for 287 “connection refused” events, not 287 rows. You see count, when it first appeared, and when it last happened. The timeline chart shows error rate per tool over time — correlate spikes across tools to find shared dependencies.
Event Log — “Show me the raw data”
Section titled “Event Log — “Show me the raw data””Screenshot placeholder: Live event log stream with expanded row showing error, timing, session
The escape hatch. Every MCP request with full detail — timestamp, method, tool name, upstream/proxy/total latency, status, error message. Live mode polls every 2 seconds. Click a session ID to jump to the Sessions view.
Global Filters — “Filter everything at once”
Section titled “Global Filters — “Filter everything at once””Screenshot placeholder: Filter bar — search, tools multi-select open with checkboxes, client dropdown, time range
One filter bar controls all views:
- Tools — multi-select dropdown to focus on specific tools
- Client — isolate one AI client’s traffic
- Status — show only errors, or only successes
- Search — text search across tool names, sessions, errors
- Time range — presets (1h to 30d) or custom date/time picker
Click a client in the breakdown strip → filter applies. Click a tool → filter applies. Everything stays in sync.
Who is this for?
Section titled “Who is this for?”MCP server developers
Section titled “MCP server developers”You build the tools that AI clients call. You need to know if your tools are healthy, which ones are slow, and what errors look like. You want to debug a user’s specific session without asking them to reproduce the issue.
Teams shipping MCP-powered products
Section titled “Teams shipping MCP-powered products”Your product integrates MCP tools for AI features. Multiple AI clients hit your server. You need client-level breakdown, SLA tracking, and the ability to answer “what changed?” when something breaks in production.
Platform teams
Section titled “Platform teams”You run MCP infrastructure for multiple teams. You need per-server dashboards, multi-client visibility, and the ability to quickly isolate whether a problem is in a specific tool, client, or shared dependency.
What Cloud adds vs the proxy alone
Section titled “What Cloud adds vs the proxy alone”| Proxy (open source) | Cloud | |
|---|---|---|
| MCP routing + CSP | ✓ | — |
| Structured events to stdout | ✓ | — |
| Protocol debugging in terminal | ✓ | — |
| Tunnel (random URL) | ✓ | — |
| Event storage + 90-day retention | — | ✓ |
| Server Dashboard (health, latency, errors) | — | ✓ |
| Per-tool status classification | — | ✓ |
| Client breakdown + per-client filtering | — | ✓ |
| Session timeline + drill-down | — | ✓ |
| Slow call detection (vs p50 outliers) | — | ✓ |
| Error grouping + timeline | — | ✓ |
| Studio (tool caller, widget preview) | — | ✓ |
| CSP Debugger | — | ✓ |
| Persistent tunnel URLs | — | ✓ |
| Custom subdomains | — | ✓ |
| Alerting | — | Coming soon |
Setup (one line)
Section titled “Setup (one line)”If you’re already running mcpr, add one line to your config:
[cloud]token = "mcpr_xxxxxxxx"server = "my-server"Events sync automatically. No schema setup, no database, no code change. The proxy emits, the cloud computes.
Get your token from cloud.mcpr.app.
Studio
Section titled “Studio”Studio is a browser-based testing environment for your MCP server:
- Tool caller — discover tools from your live proxy, auto-generated input forms, execute and see responses with timing
- Widget preview — render widgets with production-equivalent CSP enforcement, toggle between ChatGPT and Claude sandbox models
- CSP debugger — visual breakdown of which CSP rules are blocking which resources, with suggested fixes
- Request replay — pick any tool call from event history and re-execute it against your live proxy
Authentication
Section titled “Authentication”Magic link login — enter your email, click the link, you’re in. No passwords, no OAuth flow.
Getting started
Section titled “Getting started”- Sign up at cloud.mcpr.app
- Create a project and server
- Get your cloud token
- Add to
mcpr.toml:
mcp = "http://localhost:9000"
[cloud]token = "mcpr_xxxxxxxx"server = "my-server"- Run
mcpr— events sync automatically - Open the Dashboard
What gets synced
Section titled “What gets synced”Event metadata only — tool parameters and response bodies are not included. Events are batched in memory and sent via HTTPS. If the cloud is unreachable, the proxy falls back to stdout — cloud connectivity never blocks proxy operation.
Next steps
Section titled “Next steps”- Server Dashboard — tool health, latency, errors, filtering
- Sessions & Event Log — trace conversations and inspect requests
- Studio — test and debug your MCP server in the browser